Foreign trade of the Republic of Belarus
First page Back Continue Last page Text
 First page Back Continue Last page Text First page Back Continue Last page Text
 First page Back Continue Last page Text First page Back Continue Last page Text
 First page Back Continue Last page Text First page Back Continue Last page Text
 First page Back Continue Last page Text First page Back Continue Last page Text
 First page Back Continue Last page Text First page Back Continue Last page Text
 First page Back Continue Last page Text First page Back Continue Last page Text
 First page Back Continue Last page Text First page Back Continue Last page Text
 First page Back Continue Last page Text First page Back Continue Last page Text
 First page Back Continue Last page Graphics First page Back Continue Last page Graphics
First page Back Continue Last page Graphics
The Republic of Belarus is a country with an open economy. It is among first ten European states in terms of foreign trade quota (foreign trade–gross domestic product ratio) which was nearly 143% in 2005. Belarus exports over half of its products. The country’s export quota is about 69%, while in specific EU countries, such as Germany – 38%, France – 26%, Poland – 39% and Lithuania – 53%. In 2005, the foreign trade of the Republic of Belarus was estimated to be USD 32.7 billion demonstrating 8% increase compared to 2004. The turnover with the CIS countries amounted to USD 18.2 billion, or 55.6% of the total Belarusian turnover and that with the non-CIS countries – USD 14.5 billion, or 44.4% of the total turnover. The monetary value of the foreign trade with the CIS countries reduced by 5.3% and that with the non-CIS countries increased by 31.1%. First page Back Continue Last page Graphics
Main indicators of foreign trade
Dynamics of the foreign economic activity development were positive in general. Excess of the growth rates of exports of goods and services over those of imports allowed a positive foreign trade balance amounting to USD 296.4 million to be formed (in terms of balance of payment). First page Back Continue Last page Graphics
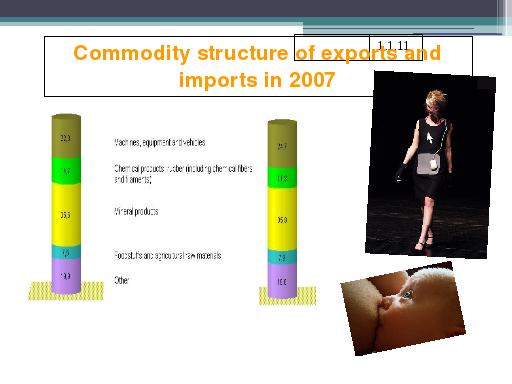
Commodity structure of exports and imports in 2007
First page Back Continue Last page Graphics
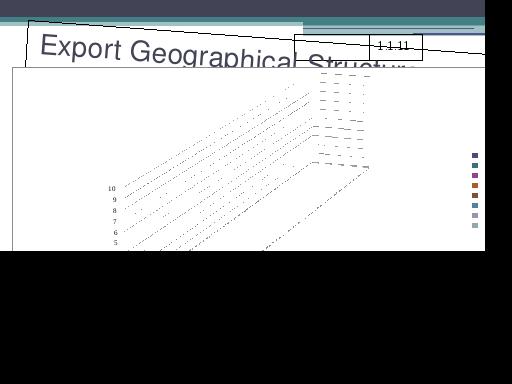
Export Geographical Structure In 2005, the export of goods from the Republic of Belarus
amounted to USD 16 billion, of it, to the CIS countries – USD 7.1 billion, with Russia accounting for USD 5.7 billion, and to the non-CIS countries – USD 8.9 billion. Belarus increased its export by 16% in actual prices as a whole. The export to the CIS countries reduced by 3.5%. The Belarusian export to Russia reduced by 11.9%, while to the non-CIS countries it increased by 38.2%. The CIS accounted for 44.2% of the Belarusian export. Belarus exported mainly the following goods in 2005: petroleum products – 30.4% of the total export, potash fertilizers (êàëèéíûå óäîáðåíèÿ) – 6.3%, ferrous(æåëåçèñòûå) metals – 4.0%, trucks – 3.8%, milk and dairy products – 3.0%, crude oil, inclusive of gas condensate(âêë-ùèé â ñåáÿ êîíäåíñàò ãàçà) – 3.0%, tractors – 2.7%, refrigerators and freezers – 1.9%. First page Back Continue Last page Graphics
Import Geographical Structure First page Back Continue Last page Graphics
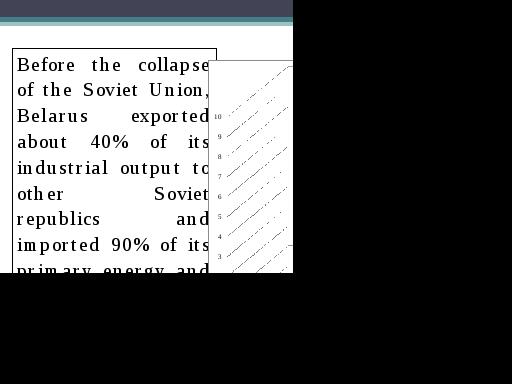
Before the collapse of the Soviet Union, Belarus exported about 40% of its industrial output to other Soviet republics and imported 90% of its primary energy and 70% of its raw materials from them. Belarus has remained exceedingly dependant on Russia for economic support; a proposed EU-style partnership between the two nations threatens its economic independence. Before the collapse of the Soviet Union, Belarus exported about 40% of its industrial output to other Soviet republics and imported 90% of its primary energy and 70% of its raw materials from them. Belarus has remained exceedingly dependant on Russia for economic support; a proposed EU-style partnership between the two nations threatens its economic independence. Belarus exported machinery and transport equipment, chemicals, petroleum products, and manufactured goods. Imports included fuel, natural gas, industrial raw materials, textiles, and sugar. Belarus' major trading partners are Russia, Ukraine, Poland, and Germany. Imports and exports grew at an annual pace of over 61% in 1995. Principal trading partners in 2008 (in millions of US dollars) were as follows… First page Back Continue Last page Graphics
So… Belarus has had a trade deficit
since 1995. The trade balance with Russia, however, has traditionally been positive. Exports to Russia exceeded imports by more than 200 percent from2000 till 2007. In the same year, the trade deficit with non-CIS countries amounted to US$433 million. During the 1996-2007 period, goods supplied by non-CIS countries were cheaper than items imported from Russia, except dairy products and grain. Vegetables, fruits, vegetable oil, margarine, and pasta imported from non-CIS countries were more than 200 percent cheaper; tea and candies were over 500 percent cheaper; meat products were 50 percent cheaper; fish was 30 percent cheaper; and sugar was 40 percent less expensive. First page Back Continue Last page Graphics
|